Second-order filters, often known as VCVS filters since their operational amplifier works like a Voltage Controlled Voltage Source amplifier, are a critical category in active filter design. These serve as fundamental elements for the construction of higher-order filter circuits, extending on previously researched active first-order RC filters.
Our analysis of analog filters has included both passive and active filter topologies. We discovered that, first-order filters can be easily converted into second-order filters by including an extra RC network into either the input or feedback circuit. As a result second-order filters can be simply defined as a combination of two cascaded first-order filters with amplification.
The second-order filter designs named after their founders such as Butterworth, Chebyshev, Bessel, and Sallen-Key, have become particularly widely recognized. Each of these filter types are capable of being configured as low pass, high pass, band pass, or band stop (notch) filters. Because they are second-order filters, they have a 40 dB per decade roll-off rate by design.
The Sallen-Key filter arrangement is a well-known and commonly used second-order filter design. Its simplicity is impressive because it only requires a single operational amplifier for gain control and four passive RC components to accomplish the appropriate tuning.
Unlike passive first-order filter circuits that use inductors, majority of active filters use just operational amplifiers, resistors, and capacitors. The cut-off point is determined by the application of feedback.
Second-order (two-pole) active filters, whether low pass or high pass, are very important in electronics engineering, because they allow us to create higher-order filters with significantly steeper roll-off characteristics. Analog filters of any nth order, odd or even, may be built with practical limitations simply by cascading first and second-order filters.
Second Order Low Pass Filter
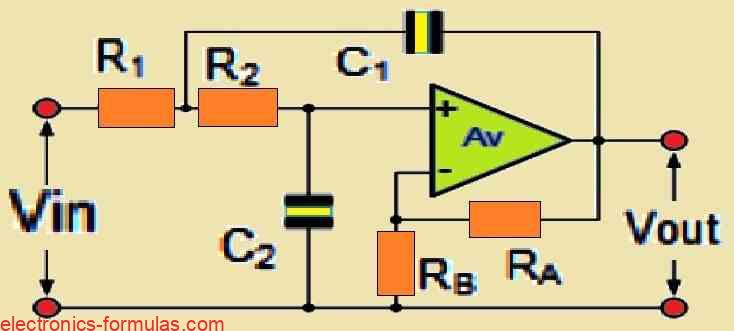
Second order low pass filters are widely utilized in several applications and are simple to construct. The following figure shows the basic setup for a Sallen-Key second order (two-pole) low pass filter:
Circuit Configuration
A second-order low pass filter built around a non-inverting operational amplifier architecture is shown in the circuit.
Two RC networks, R1-C1 and R2-C2, are the fundamental elements that define the frequency response characteristics of the filter.
One important feature of the operational amplifier is its high input impedance, which allows it to be seamlessly integrated with other active filter stages to create more complex filter designs.
Gain and Frequency Response
The non-inverting amplifier arrangement with Gain, A = 1 + RA/RB indicates that the filter’s gain, A, is fundamentally bigger than unity.
The RC network produces a normalized frequency response that is similar to that of a first-order low pass filter.
But one characteristic that sets the second-order filter apart is that it has a sharper roll-off rate in the stopband.
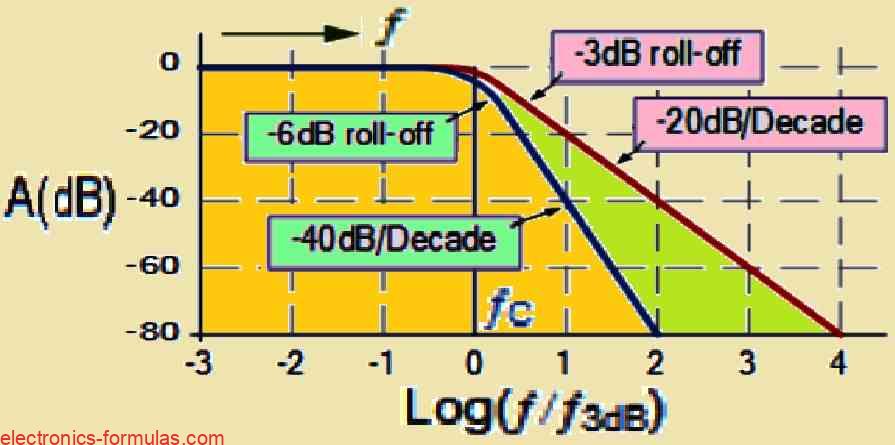
As the operating frequency rises beyond the cutoff frequency (fc), this roll-off rate decreases by 40 dB per decade, or 12 dB per octave. The use of two RC stages as opposed to the single RC stage that exists in first-order filters is directly responsible for this faster roll-off.
Cutoff Frequency Calculation
The following calculations could be utilized to calculate the cutoff frequency (fc), at which the filters gain is lowered by 3 dB.
For varying values of the resistor and capacitor:
fc = 1 / (2π√(R1R2C1C2))
If the resistor and capacitor values are same then: fc = 1 / (2πRC).
In basic terms, the second-order low pass filter provides better attenuation of high-frequency signals than its first-order cousin, making it a useful component in a variety of electronic systems that require precise frequency shaping.
Normalized Low-Pass Frequency Response
The figure below shows the normalized low-pass frequency response, which is similar to the first-order filter response but it demonstrates a sharper roll-off rate of -40 dB per decade in the stopband.
A fundamental feature in second-order filters is the wide range of their response characteristics, which is determined by the circuits voltage amplification factor, indicated as Q, at the cutoff frequency point.
In active second-order filters, the damping factor, denoted by ζ (zeta) is frequently used. It is inversely proportional to Q, and both quantities are altered independently by the amplifier’s gain A. In simple terms, a decrease in Q produces an increase in the damping factor.
Although a low-pass filter always remains low-pass, it might have a resonant peak close to the cutoff frequency, which causes the amplifier to increase gain quickly due to its resonance. The “peakiness” of this resonance, which includes its peak and narrowness around the cutoff frequency point, fc, is measured by the quality factor, Q. It could be crucial to remember that a filter’s gain also affects how much feedback is present which has a big impact on the filter’s total frequency response.
An active filter’s gain should generally not exceed three in order to ensure stability. This can be best described through the following formula:
Relationship between Quality Factor, “Q” and Opamp filter Gain
A = 3 – (2 * ζ)
Where, ζ = (3 – A)/2 = 1/2Q
∴ A = 3 – (1/Q)
From this, we can clearly see that the filter’s gain A, for a non-inverting amplifier arrangement has to be in the range of 1 to 3 (i.e., the damping factor, ζ, should be between zero and 2). Thus as indicated, a bigger response peak and a faster starting roll-off rate are produced when the values of Q is higher or when the values of ζ is lower.
Response Curve of Second Order Filter Amplitude
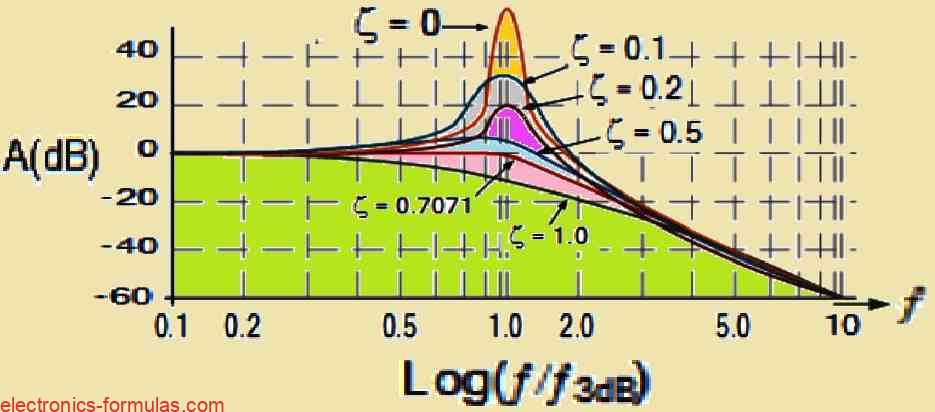
Second-Order Low-Pass Filter Response and Damping Factor
A second-order low-pass filter’s amplitude response is strongly impacted by the damping factor, or ζ (zeta). This factor controls how the frequency response curve is shaped.
Overdamping
The filter is said to be overdamped when ζ is larger than or equal to 1.0 (maximum value of 2). In this state the frequency response is a gradual, elongated flat curve with no noticeable peaks or oscillations.
Underdamping
On the other hand, the filter functions in an underdamped state when μ = 0. In this case the output exhibits a clear spike-like peak at the cutoff frequency. This phenomenon is caused by the resonance effects in the circuit.
Critical Damping
There is a critical damping point, where ζ is exactly 0.7071, between the two extremes of overdamping and underdamping. The frequency response remains best balanced at this value, preventing ringing or excessive overshoot yet enabling a quick transition from the passband to the stopband.
In simple terms the damping factor controls the trade-off between response time and overshoot in a second-order low-pass filter.
Self-Oscillation and Filter Characteristics
It is important to remember that too much feedback might cause the filter to self-oscillate especially if it achieves a gain of four or higher. Resonant amplification causes this phenomena at the cutoff frequency, turning the filter into an oscillator.
The behavior of second-order low-pass filters is greatly influenced by the damping factor (ζ) and quality factor (Q).
Upon examining the normalized frequency response curves, we find that, up until it reaches the cutoff frequency (fr), the first-order filter (shown by the red line) continuously maintains a flat passband gain. This is the so-called -3 dB point, when the gain drops to 1/√2 or 0.7071 of its highest value. Interestingly, the damping factor in first-order low-pass filters remains fixed at unity (ζ = 1).
In a nutshell the response shape of the filter is determined by the balance between Q and ζ, wherein too much Q can cause significant peaking and even instability, while the right amount of damping guarantees a steady and an uniform frequency response.
Gain Adjustment and Cutoff Frequency in Second-Order Filters
Second-order filters have a sharper roll-off rate of -40 dB per decade, which causes the -3 dB cutoff point to take place at a different frequency than in first-order filters. This means that the corner frequency (fr) shifts as the filter order increases.
A small gain adjustment is required to match the -3 dB point of a second-order filter with that of a first-order filter. Depending on the kind of filter, different gains will be required:
Butterworth: A 1.586 gain is required.
Bessel: You need a gain of 1.268.
Chebyshev: You need a gain of 1.234.
For various types of second-order low-pass filters, the necessary -3 dB cutoff frequency could be attained by applying these gain modifications.
Solving a Second Order Filter Circuit Problem#1
Design a second-order low-pass filter by means of a non-inverting operational amplifier circuit. The filter components, resistors R1 and R2, and capacitors C1 and C2, need to be the same. Given a target quality factor (Q) of 5 and a cutoff frequency (fc) of 160 Hz, choose appropriate filter component values and in pictures illustrate its frequency response.
Data in hand: R1 = R2, C1 = C2, Q = 6, and fc = 160 Hz.
Through the circuit design learned in the above sections we realize that when resistances and capacitances have identical values, the cut-off frequency point, fc can be calculated as:
fc = 1/2πRC
If we select some appropriate value for the resistor for example 9.1kΩ’s, then the resultant capacitor value could be calculated with the following calculations:
fc = 1/2πRC
∴ C = 1/2π * R* fc
∴ C = 1/(2π * 9100 * 160)
= 109.30 nF or 0.19 μF
Therefore we have, for a cut-off corner frequency of 160 Hz, R = 9.1kΩ and C = 0.19 μF.
Now, since the value of Q = 6, we can quickly calculate gain of the filter A in the following manner:
Q = 6, and A = 3 – (1/Q)
∴ A = 3 – (1/6) = 3 – 0.16 = 2.84
We are already aware know from our previous discussions that the gain of a non-inverting op-amp can be calculated using the following formula:
A = Vout/Vin = [1 + (RA/RB)] = 2.84
Thus, RA/RB = 1.84
If we take RA as 9.1kΩ, then RB = 4.94 kΩ
Therefore now we can finally draw the resultant second order low pass filter circuit diagram as shown below:

Analysis of Frequency Response and Q Factor
Because of the high Q value of 6 we observe that the frequency response curve peaks dramatically at the cutoff frequency. We therefore determine the gain of the filter by multiplying Q by A which comes out to be 14 or around +23 dB. This is a considerable deviation from the +8.9 dB or 2.8 speculated result.
However a lot of publications say that the gain should be at -3 dB at the normalized cutoff frequency. In order to do this we must significantly lower Q to 0.7071 which gives us a gain A of 1.586. This results in a maximally flat passband that is similar to a second-order Butterworth filter response with a -3 dB attenuation at the cutoff point.
It is clear that although a second-order filters cutoff frequency could be modified independently, the damping factor, ζ, has a big impact on how far the filter deviates from the intended cutoff point. Moreover the filter sections cascading allows the development of higher-order active filters with tunable characteristics.
While creating higher-order low-pass filters, We can usually figure out the damping factor and matching gain for each second-order component to achieve the appropriate overall response, after fixing the cutoff frequency for the first-order section (if the filter order is odd). As we shall see in the Butterworth Filter lesson, tabular values for ζ, Q, and A are readily available for active filters, making this design process simpler. Let us investigate a specific illustration below.
Solving a Second Order Filter Circuit Problem #2
Here, we want to design a non-inverting second order Low Pass filter which must have the following filter characteristics: Q = 1, and fc = 80 Hz.
Through the above values, we can calculate the corner frequency fc of the filter as explained below:
fc = 1/2πRC
We can select an appropriate value for the filter circuit resistors as 1.2 kΩ for the filters resistors, which then provides as with the resultant capacitor values as per the following calculations:
fc = 1/2πRC
∴ C = 1/2π * R * fc
∴ C = 1/(2π * 1200 * 80)
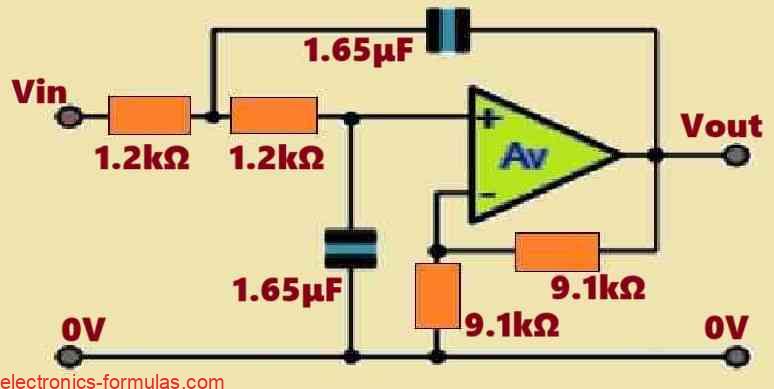
∴ C = 1.65 μF
Thus with a cut-off frequency value of 80 Hz, or 502.65 rads/s, R = 1.2 kΩ and C = 1.65 μF, and also with a value of Q = 1 in hand, we can calculate the filters gain A in the following manner:
Q = 1/2ζ
∴ ζ = 1/2Q = 1/2 *1 = 0.5
ζ = 0.5 = (3 – A)/2
∴ A = 3 – 2ζ = 2
From your previous data we already know about the voltage gain for a non-inverting op-amp circuit to be:
A = Vout/Vin = [1 + (RA/RB)] = 2
Thus, RA/RB = 1
If we take RA as 9.1kΩ, then RB = 9.1kΩ
Circuit Diagram for the Resultant Low Pass Filter
Thus, from all the above calculations, the second order low pass filter circuit having a Q of 1, and a corner frequency of 80 Hz can be illustrated using the following diagram:
High Pass Second Order Filter Circuits
There are not many distinctions in my opinion, between the second-order low-pass and high-pass filter setups. The main difference is where the resistors and capacitors are positioned differently, as seen in the diagram below. The low-pass filter is transformed into a high-pass filter as a result of this modification. In both the arrangements, the operational amplifier and the other parts are the same.
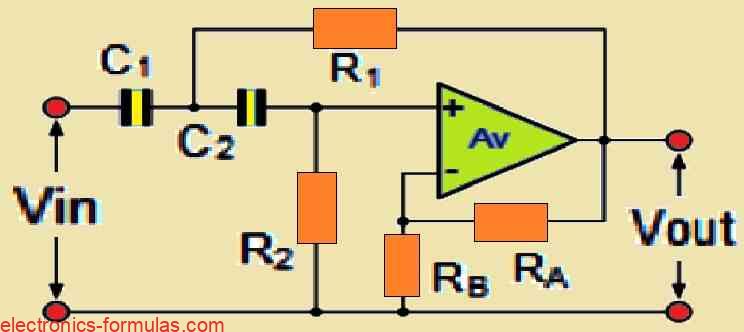
The resistors in the low-pass filter are attached to ground line and the capacitors are connected in series with the input and feedback sources. On the other hand the resistor and capacitor positions are reversed in the high-pass filter.
The formulae for calculating the cutoff frequency of the filter are the same as those for the low-pass filter, however, the values of the resistors and capacitors should be swapped with each other.
If the values of the resistor and capacitor differ:
fc = 1/2π√(R1R2C1C2)
If the values of the resistor and capacitor are the same:
fc = 1/2πRC
The filter’s gain, which is the same as that of the low-pass filter, is determined by:
Gain(Av) = 1 + RA/RB
Since the low-pass and high-pass filter topologies are equivalent and just require a simple swap of resistors and capacitors, the high-pass filter’s design and frequency scaling procedures are the same as those of the low-pass filter that we previously discussed. As a result, the Bode plot for a second-order high-pass filter takes the shape as seen in the figure.
The typical -40 dB/decade roll-off in the stopband which is identical to the behavior of a low-pass filter, is seen in the Bode figure. In the present situation the passband extends towards higher frequencies, whereas the stopband is situated at lower frequencies.
The transition from the stopband to the passband is indicated by the -3 dB cutoff frequency, at which the gain is lowered by 3 dB in comparison to the passband. This is a critical factor to consider while assessing the filter’s performance characteristics.
The quality factor (Q), like the low-pass filter affects the response shape of the filter. A flatter response is produced by a lower Q value whereas a higher Q value produces a more prominent peak in the passband.
Normalized High Pass Frequency Response
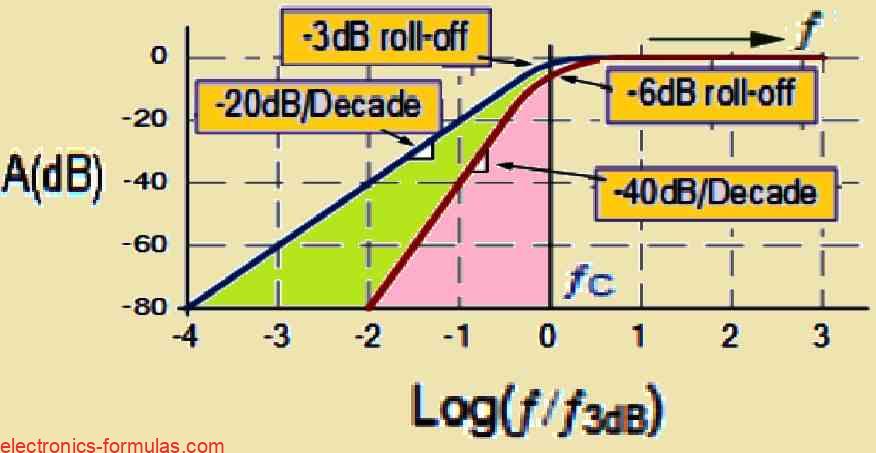
We can see that the steep -40 dB/decade characteristic of the stopband roll-off is similar to that of the previous low-pass filter.
The amplifier’s feedback network determines the op-amp voltage gain, or Av, in both of the circuits that we witnessed. This gain level applies to all frequencies that are well within the filter’s passband range. We can simply add a constant gain factor, K, to independently modify the output amplification.
Because of the connection that exists between the output of the op-amp and the positive terminal of the op-amp, second-order Sallen-Key filters are occasionally referred to as positive feedback filters. Due to the involvement of just one op-amp, this design method has become popular owing to its low complexity and affordability.
References: SECOND-ORDER FILTERS
Leave a Reply