So in AC systems, we can show the relationship between voltage and current using something called a phasor diagram. This is like a graphical tool to explain how voltage and current are connected with respect to their phase.
To make this diagram, we use a reference phasor and a coordinate axis. Now even if the frequency is same, two sine wave signals can still have some phase difference, right? That phase difference is shown using phasors.
This difference can be described using simple terms like:
- Lead (when one waveform comes before the other)
- Lag (when one comes after)
- In-phase (when both come together)
- Out-of-phase (when both are not in sync)
Now, if we want to write the general sine wave for time, we can write it like this:
A(t) = Am × sin(ωt ± Φ)
But visualizing this angular difference using math is tough sometimes. So that is why we use phasor diagrams, these make things easy by using rotating arrows (vectors) to show phase and amplitude together in one diagram.
These arrows are called phase vectors and they show us the magnitude and angle of the waveform. But they are shown frozen in time, at one moment.
How These Vectors Work
So here’s how the vectors look:
- It looks like an arrow where the arrowhead shows the maximum value and the arrow tail stays fixed at one point – called the origin.
- When the waveform is positive, the vector rotates counter-clockwise.
- When the waveform is negative, the vector rotates clockwise.
Now remember, both vectors and phasors are like spinning lines, showing magnitude and direction. But when we are using AC circuits with resistance and reactance, we always use phasors because they represent the RMS value of sine wave.
The speed of rotation of this phasor is called angular velocity (ω) and it is given by:
ω = 2πf
This phasor spins in anti-clockwise direction and after one full spin, we get one full sine wave.
Mathematical Forms of Phasors
We can write phasors in different ways:
- Rectangular form (like a + jb)
- Polar form
- Exponential form
Even though vectors and phasors both spin, vectors follow parallelogram rule when we add or subtract them.
But when we use phasor method, it shows only the RMS value of voltage or current, not the peak.
So in phasor diagram drawing, the angular velocity of the waveform is usually written as ω in radians per second. That is how we analyze how far one waveform is ahead or behind the other one.
And if we see a real phasor diagram image, we can easily understand who is leading, who is lagging and what angle they are separated by.
Sinusoidal Waveform Analysis using Phasor Diagrams
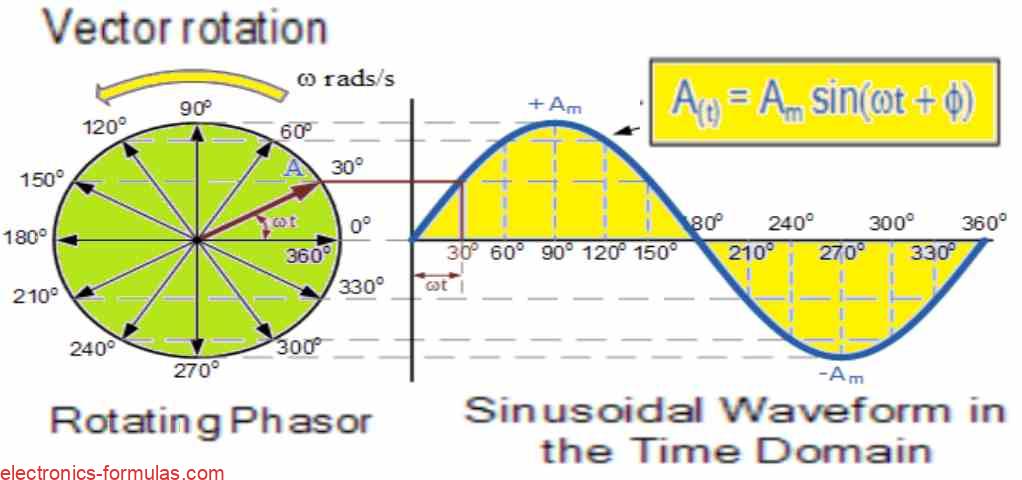
How Phasor Rotation Makes a Sine Wave
So as the phasor vector keeps rotating in counterclockwise direction, we will see that point A goes round and completes one full round, that is 360 degrees or 2π radians, right? This full round is same like one full AC cycle.
Then, when we plot the length of the moving arrow tip at many different angles, we will see that this makes a nice sine wave which always starts from zero at time t = 0.
Now the horizontal axis here shows the time that has passed from t = 0. The rotating arrow tip will be:
at 0 degrees, then again at 180 degrees and at 360 degrees when it is horizontal.
and it will be at +Am (maximum upward) when it is at 90 degrees or π/2.
and it will be at -Am (maximum downward) when it is at 270 degrees or 3π/2.
Time Axis and Phasor Angle
So, here we understand one more thing, the time axis of this sine wave is actually showing the angular movement of the phasor in degrees or radians, same like the rotating vector’s position.
Now if we want then we can use a phasor to show a scaled voltage or current value and freeze it at one particular angle – like suppose 30 degrees – and that will show its exact position in rotation at that moment.
Why Phasor Position is Important
It is very very important to know the position of phasor when we are trying to analyze AC waveforms, especially when we are comparing voltage and current together.
Then we must check if there is a phase difference Φ between two waveforms. This happens when one waveform starts a little before or after the other one. So that time we use phasor notation to show their exact relationship.
This is how we can easily know which waveform is leading and which one is lagging and how much angle is between them.
Sinusoidal Waveform and its Phase Difference
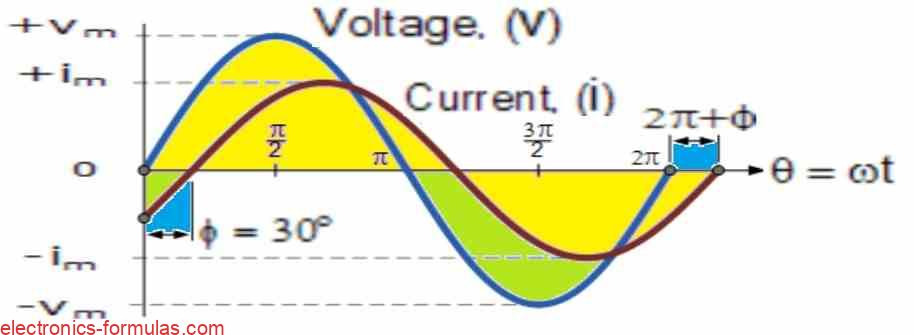
These two sinusoidal values can be represented mathematically as follows:
- V(t) = Vm sin(ωt)
- i(t) = Im sin(ωt – Φ)
In the illustration above, the angle Φ indicates the 30° lag between the current (i) and voltage (v). The phasor diagram that results will be equal to angle Φ, which is the difference between the two phasors that signify the two sinusoidal variables.
Sinusoidal Waveform Phasor Diagram

As can be seen, the phasor diagram is based on the horizontal axis at time zero (t = 0), with phasor lengths proportional to voltage (V) and current (I) values.
Now the current phasor lags behind the voltage phasor by an angle Φ, since both rotate counterclockwise.
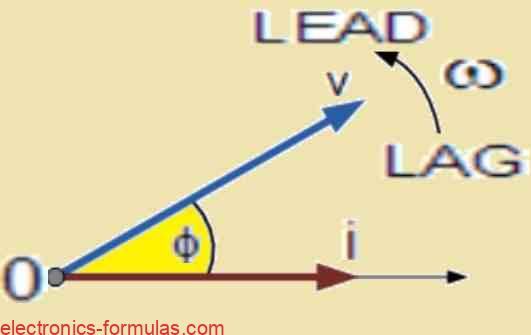
Because of the shared frequency, the current phasor lags behind the voltage phasor at t = 30°.
The current phasor intersecting the horizontal zero axis serves as the new reference, with the voltage phasor “leading” by angle Φ. One phasor acts as the reference while others either lead or lag after it.
Phasor Diagrams: The Process of Adding Phasors
So like we already learned above, phasors are very helpful tools when we want to add or sum sinusoidal waveforms which have the same frequency.
Now suppose if all the waveforms are in-phase then we can just add their values directly, same like how we add DC voltages.
But then if they are not in-phase and one waveform is leading or lagging, then we cannot add them directly. That time we must take care of the phase angle between them.
Then we can use Phasor Diagrams for this and use something called the Parallelogram Law to add them properly.
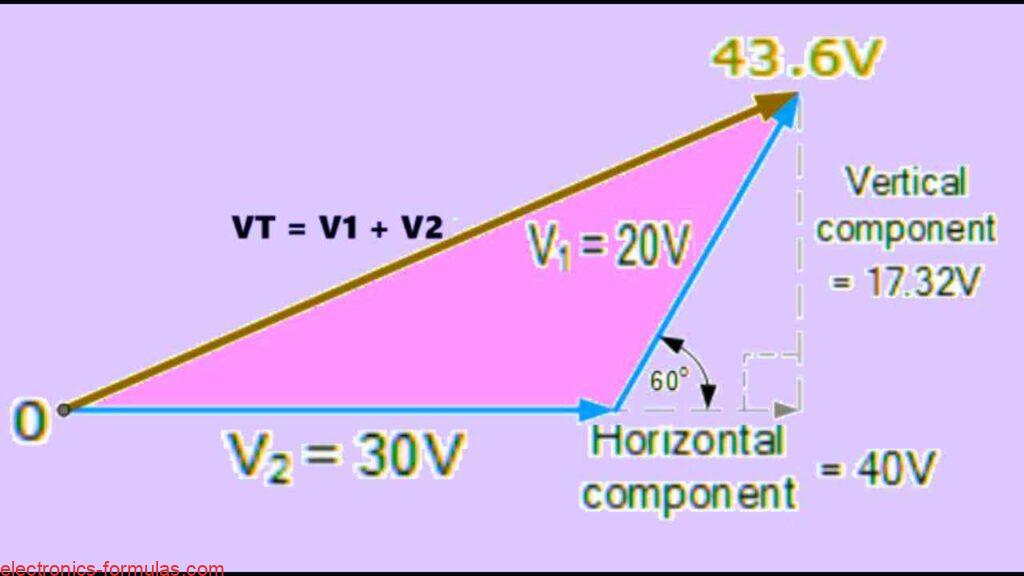
Example for Adding Two Phasors
Let us take one simple example to understand this. Suppose, if:
V1 has a peak voltage of 20 volts
and V2 has a peak voltage of 30 volts
but V1 is leading V2 by 60 degrees
Then we cannot just say 20 + 30 = 50 volts. No, it will not be correct.
So what we do is, we draw a phasor diagram. We show V1 and V2 with proper angle between them and then we construct a parallelogram using these two phasors.
The diagonal of this parallelogram will give us the total resultant phasor, which we can call VT.
This is how we get the exact total phasor sum of V1 and V2, even when they are not in same phase.
The Process of Combining Two Phasors through Phasor Addition

Accurate Way to Add Phasors: Graphical and Rectangular Form
So suppose if we want to find the phasor sum of V1 + V2 in a very proper and exact way then one method is the graphical method.
In this graphical method, we take a graph paper and then we draw the phasors properly to some scale like using protractor and ruler. After that we just draw the resultant vector which we also call the r-vector, and then we measure its length. That length gives us the total resultant VT.
But this method is not always easy. Many times it becomes very time-consuming and if we do not draw it very perfectly then it can give wrong results. So it may not be suitable for quick or accurate calculations.
Easy and Accurate: Rectangular Form Method
So for better results, we can also use a mathematical method which is called the Rectangular Form method.
In this method, we break each voltage into its horizontal and vertical parts, that means we take the cosine part and the sine part of the voltage phasors.
Then we calculate the total horizontal component and total vertical component of the final r-vector (VT).
Formula Style in Rectangular Form
In Rectangular Form, we write each phasor like this:
Z = x ± jy
Where:
- x is the real part (horizontal part)
- y is the imaginary part (vertical part)
- j means √–1, used in AC math
So this kind of expression helps us to represent both the magnitude and the angle (phase) of any sinusoidal voltage or current in one single line.
This method is very accurate, fast, and very useful when we are dealing with many phasors in AC circuits.
Understanding Complex Sinusoid
v = Vm cos(Φ) + jVm (sinΦ)
Thus, when you add together vectors A and B, using the general expression mentioned earlier, the result is:
A = x + jy
B = w + jz
A + B = (x + w) + j(y + z)
Adding Phasors in Rectangular Form
Let us now take one real example and do the full phasor addition by using the Rectangular Form method. Here we have two voltages, V2 and V1.
Step 1: Finding Horizontal and Vertical for V2
As we can see, the voltage V2 is having magnitude of 30 volts and it is going exactly along the horizontal axis, that means its angle is zero degrees.
So then:
- Horizontal Component of V2 = 30 × cos(0°) = 30 × 1 = 30 volts
- Vertical Component of V2 = 30 × sin(0°) = 30 × 0 = 0 volts
So the rectangular form of V2 becomes:
V2 = 30 + j0
That means 30 volts in the horizontal direction and 0 in vertical.
Step 2: Finding Horizontal and Vertical for V1
Now we take V1 which is 20 volts and it is leading V2 by 60 degrees. So that means it is tilted 60° ahead of the horizontal.
Then we can break it into both horizontal and vertical components.
- Horizontal Component of V1 = 20 × cos(60°) = 20 × 0.5 = 10 volts
- Vertical Component of V1 = 20 × sin(60°) = 20 × 0.866 = 17.32 volts
So the rectangular form of V1 becomes:
V1 = 10 + j17.32
So now we have both voltages converted into rectangular form.
Step 3: Adding Both Voltages to Get Resultant
Now we just have to add horizontal with horizontal and vertical with vertical.
- Total Horizontal (Real) Component = 30 + 10 = 40 volts
- Total Vertical (Imaginary) Component = 0 + 17.32 = 17.32 volts
So now the final rectangular form of resultant voltage VT becomes:
VT = 40 + j17.32
Step 4: Finding Magnitude of Resultant VT
If we now want to find the actual size or length of this final voltage VT then we can use the Pythagoras Theorem.
VT = √[(Real or Horizontal Component)2 + (Imaginary or Vertical Component)2 ]
So then:
|VT| = √(40² + 17.32²)
= √(1600 + 299.86)
= √1899.86 = 43.58 volts
The phasor diagram that follows will be:
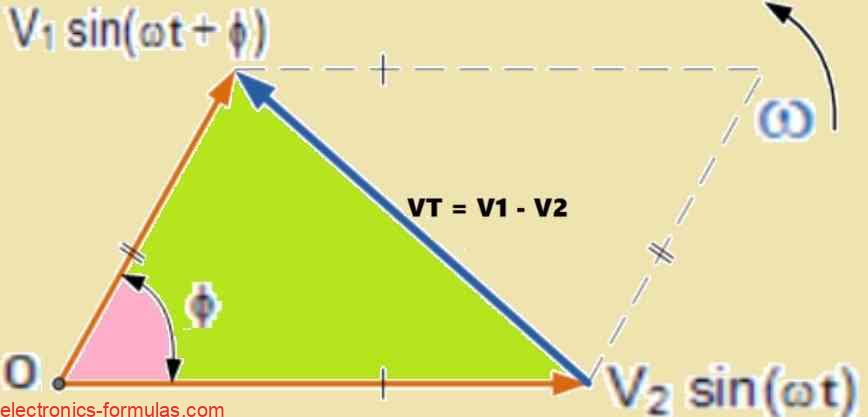
How to do Phasor Subtraction of Phasor Diagrams
Here also we are dealing with the same kind of idea like we did in phasor addition before. But now it is for phasor subtraction, not addition.
Now what we do is almost same like before, we again use the Rectangular Method.
But the only big change is instead of adding both vectors now we are doing subtraction between two phasors like V1 – V2.
So when we draw the parallelogram using V1 and V2 vectors then resultant vector or the vector difference does not go through the addition side of the diagonal. Instead it goes along the opposite diagonal which shows the subtracted phasor value.
How to do Phasor Subtraction of Two Phasors
Here, we are subtracting the horizontal and vertical components instead of adding them together.
- A = x + jy
- B = w + jz
- A – B = (x – w) + j(y – z)
Understanding 3-Phase Phasor Diagrams
So before we were learning about single-phase AC waveforms where we just had one rotating coil inside a magnetic field, right? That gave us a simple sine wave.
But now if you want to make a three-phase AC supply then you just need to add two more coils. These three coils must be exactly identical and you must place them at 120 degrees electrical angle apart from each other, on the same rotor shaft.
Then what will happen? All three coils will start producing AC voltages but now all will be 120 degrees out-of-phase from each other.
This kind of setup gives us what we call a Balanced Three-Phase Voltage Supply.
That means:
- All three waveforms will have the same frequency,
- All will have same peak value or amplitude,
- But they will be shifted by 120° electrical angle from each other.
Now in real-world wiring, we also give color names to these phases. So we call them:
- Red Phase (R) – This is taken as our reference phasor.
- Yellow Phase (Y)
- Blue Phase (B)
These three phases come in proper order, and we say that the rotation sequence is:
Red → Yellow → Blue, or R → Y → B.
Now just like in single-phase systems where the phasor rotates in a counter-clockwise direction, the three-phase phasors also rotate anti-clockwise and they all spin together around a center point.
This spinning happens with an angular speed of ω radians per second and it is usually marked in diagrams with an arrow labeled as ω (rad/s).
So if you want to draw or see the phasors for a balanced three-phase system, whether it is Star-connected (Y) or Delta-connected (Δ) then you will see three arrows, 120 degrees apart, all spinning together in anti-clockwise motion from a single center.
Three-phase Phasor Diagrams
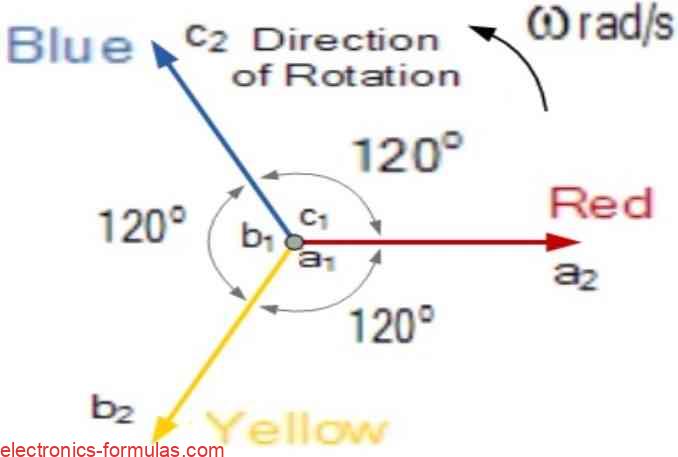
So here we are checking a balanced three-phase system and what we find is something interesting.
We see that the magnitudes of all three phase voltages are equal. That means each coil is producing the same peak voltage or rms value but there is one big difference.
Their phase angles are not same—they are 120 degrees apart from each other.
Now if you look at how the coils are connected, you will find that all three coil windings are joined at one common side. These connection points are called a1, b1, and c1, and they are brought together to form a shared neutral point.
So then this common point becomes the neutral wire for the whole three-phase setup.
Now if you assume that the Red Phase is the reference point (which is a standard way) then you can measure or calculate the voltage of each phase in respect to this common neutral point.
And we can show or express those phase voltages mathematically and with phasors just like shown below in diagrams.
- Phase (Red): VRN = Vm sinθ
- Phase (Yellow): VYN = Vm sin(θ – 120o)
- Phase (Blue): VBN = Vm sin(θ – 240o) or VBN = Vm sin(θ + 120o)
Now we are taking VRN as the reference voltage. That means we are starting with Red Phase as our zero-degree point. Then what happens?
The phase sequence becomes R – Y – B or you can say Red, Yellow, Blue.
Then if you check carefully, you will see that the Yellow Phase is lagging behind the Red Phase VRN by 120 degrees. And again the Blue Phase is lagging behind the Yellow Phase VYN by another 120 degrees.
But alternatively if you want to say in reverse then you can also say that Blue Phase VBN is actually leading Red Phase VRN by 120 degrees.
Now in a balanced three-phase system, because the three sinusoidal voltages are always equal in amplitude and are having this fixed 120-degree separation, their phasor sum will always come out to be zero.
So that means:
Va + Vb + Vc = 0
Conclusion About Phasor Diagrams
As we already saw earlier, the phasor diagrams are just a way to project rotating AC vectors on a horizontal axis. And this projection shows us the instantaneous value of that AC signal at any given time.
But please remember, these phasor diagrams are only for pure sinusoidal AC quantities. That means we can use them only when the waveforms are perfect sine waves.
Also, in any phasor diagram, we fix the reference phasor along the positive x-axis and all other phasors are drawn relative to this reference.
Then these phasors will rotate in anti-clockwise direction and depending on whether they are ahead or behind the reference, we call it leading or lagging.
Also one more very important thing. The length of each phasor always shows its rms value of that AC waveform, not peak value.
And yes do not forget, phasor diagrams cannot have sinusoids of different frequencies on the same drawing. Only same-frequency vectors can be used. Then only we can add or subtract them like vectors and get the resultant vector.
And finally in any balanced three-phase system, the three phasors are always displaced by exactly 120 degrees from one another.
Leave a Reply