In this post, we are talking about amplifiers and filters. These are two very common types of electronic circuits that we use a lot. Now if we see how they work then we can say that amplifiers do amplification and filters do filtration. That is why we call them that.
Amplifiers and Filters Together
But if we go a little deeper then we will see that both these circuits together make something that responds to frequencies within a certain upper and lower limit. This means that they allow only a specific range of frequencies to pass.
What Amplifiers and Filters Do
Now amplifiers mainly give gain which means they increase the strength of a signal. But filters on the other hand do not just amplify but also modify how the amplitude behaves and sometimes they also change the phase of the signal depending on its frequency.
Components Used in These Circuits
So if we see what these circuits are built with then we will notice that they use resistors, inductors and capacitors which together form what we call RLC networks. Because of these reactive components, there is a big connection between how we use them and how the circuit will respond to different frequencies.
Frequency in AC Circuits
Now in AC circuits we normally assume they work at a fixed frequency, like either 50 Hz or 60 Hz, right? But that is not always the case. Instead of just keeping one fixed frequency, we can also check how an AC circuit behaves if we apply a signal that has a constant strength but keeps changing its frequency.
Frequency Response Analysis
This kind of thing is mostly seen in amplifier and filter circuits. So when we do this then it helps us study how the circuit reacts to different frequencies which we call frequency response analysis.
Understanding Frequency Response Analysis
Ok, so here we are talking about how we analyze frequency response for a circuit or system, right? Now normally, we do this by plotting a graph that shows how much gain the circuit has. Gain just means how much the output signal is compared to the input signal, like Output/Input.
So, we take this gain and put it on a frequency scale that makes sense for that circuit, ok? By doing this, we can see how well or badly the circuit treats different frequency signals.
If gain is high at some frequencies, then it tells us which frequencies the circuit likes, and if gain is low at some frequencies, then it tells us which frequencies the circuit does not like, right?
Frequency Response Graph
Now if we have a circuit where gain changes with frequency, then we can show this using a graph. This graph has frequency (ƒ) on the x-axis and gain (magnitude) on the y-axis.
But the frequency scale is not simple—it is a logarithmic scale, meaning each step is multiplied instead of added, ok?
Meanwhile the y-axis which shows gain or output voltage, is usually a normal linear scale with decimal values. Since gain can go both up and down, then the y-axis has both positive and negative values, right?
Logarithm in Electronics
Now in electronics, we use something called a logarithm (log), which just tells us how many times we must multiply a base number to get another number. In graphs like Bode plots, the frequency axis uses log10 steps.
That means the values go like 0.01, 0.1, 1, 10, 100, 1000, and so on. This way if frequencies are plotted then they are spread evenly across the x-axis, right?
If we do the reverse of a logarithm then we call it an antilogarithm or just “antilog.”
Bode Plots
Now when we draw frequency response curves using this method, then we call them Bode plots. These Bode plots are what we call semi-logarithmic graphs.
This means that if the x-axis is logarithmic then the y-axis is linear, so it is a log-lin type graph, ok? This is how we visualize how a circuit behaves at different frequencies.
So now frequency response simply tells us how the output of an electrical or electronic circuit changes when we give it different frequencies.
We mainly look at two things—first the gain which we also call the magnitude response and second the phase shift which we call the phase response.
Now we can do this for just one single frequency or for a whole range of frequencies starting all the way from 0 Hz which is DC and going up to many thousands of MHz depending on how the circuit is designed.
Waveform Curve of Frequency Response
Understanding Frequency Response
Thus, we can see that when we check the frequency response of any circuit then that actually shows us how that circuit behaves when we keep changing the input signal frequency, right? So it tells us about the range where the output and also the gain remain more or less steady.
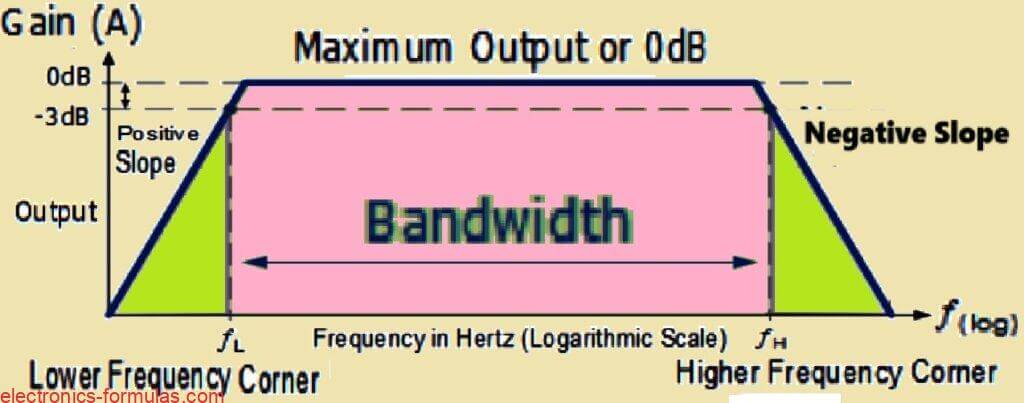
What is Bandwidth?
Now the gap between these two frequencies, one lower (ƒL) and one higher (ƒH), whether small or big, is what we call the bandwidth of that circuit? So by knowing this we can easily check how much voltage gain (in dB) we are getting when we apply a sine wave input across different frequencies.
Role of the Bode Diagram
Like we already said before, the Bode diagram is nothing but a way to show this frequency response using a logarithmic scale. But most modern audio amplifiers do not change their response much, instead they stay flat, as we see above, right from 20 Hz all the way up to 20 kHz.
That whole range from 20 Hz to 20 kHz is what we call the Bandwidth (BW) of the amplifier and this BW depends entirely on how the frequency response of the circuit is designed.
Cut-off Frequencies and -3dB Points
Now if we look at these two frequency points ƒL and ƒH then that we talked about, these are actually called the lower and upper cut-off frequencies. So what happens at these points?
The gain of the circuit starts dropping when we go too low or too high in frequency. These two spots on the frequency response curve are normally called the -3dB points because that is where the gain starts to fall.
Expression for Bandwidth
Ok so now lets talk about bandwidth. That means how much range of frequency we are dealing with. We say it like this:
Bandwidth (BW) = fH – fL
Understanding Decibels (dB) and Gain
Now the dB is decibel that we use for measuring gain but it is not linear, ok? It is actually 1/10th of a bel (B) so that means it is logarithmic. We calculate it like:
20 log10(A)
Here A is the decimal gain which is what we plot on the y-axis when we make frequency response graphs. Now zero dB (0dB) means no change in magnitude, so output is exactly same as input, maximum possible output, right? That means Vout = Vin, no loss, no attenuation and nothing. The formula for this is:
VOUT / VIN = 1
That means:
20 log(1) = 0 dB
What Happens at Cut-Off Frequency?
So if we check the Bode plot, What happens? At two special points which we call corner or cut-off frequency points, the output gain does not stay the same. It starts falling, but how much? From 0dB, it goes to -3dB and keeps reducing at a fixed rate. We call this drop the roll-off region of the frequency response.
Roll-Off Rate in Amplifiers and Filters
Now in basic amplifier and filter circuits, if we have a first-order system (single-order) then this roll-off rate is 20dB per decade, right?
That means if frequency increases 10 times, then gain reduces by 20dB. Another way to say it is same as 6dB per octave, because octave means doubling frequency.
Now if we have a higher-order circuit, Maybe second-order, third-order, then this roll-off rate multiplies. So for second order it becomes 40dB/decade, for third order 60dB/decade and so on.
Understanding the Roll-Off Region in Frequency Response
If we carefully check that Bode plot right up there, then we can clearly notice that exactly at those two specific corner points, or we also call them cut-off frequency points, the output level which was initially sitting at 0dB, suddenly starts dropping down and reaches -3dB, right?
But it does not just stop there. No, it keeps on decreasing further at a constant and steady rate. Now this kind of downward sloping or decreasing behavior of the gain, we generally call it the roll-off region of that frequency response curve, right?
Now if we take any simple and basic single-order amplifier or filter circuit, then we see that this roll-off characteristic always follows a fixed rule which says that the rate of this downward slope will be 20dB per decade. That means for every tenfold increase in frequency, then the gain will reduce by 20dB.
But if we talk in octave terms then that same rate converts to 6dB per octave, meaning every time frequency doubles, then gain drops by 6dB. Now this roll-off rate is not always the same for every circuit. No, if the circuit order increases then we multiply these roll-off values by that order number, right?
Significance of the -3dB Cut-Off Points
Now coming to those -3dB points, what do they actually tell us? Well, these points exactly mark the specific frequency values where the output gain is no longer at its peak level.
No it has actually reduced down to 70.71 percent of that maximum value. So if we express that in a ratio form then we can say that the system’s gain at these cut-off points has now become 0.707 times its maximum gain value, right?
So that is why when we talk about this -3dB point then we can also correctly say that this is exactly the frequency where the system’s gain has decreased to 0.707 of its highest possible value.
Frequency Response -3dB Point
The -3dB point is also known as the half-power point since the output power at this corner frequency will be half of its maximum 0dB value as shown.
-3dB = 20 log10 (0.7071)
P = V2 / R = I2 × R
At fL or fH,
V or I = 70.71% of maximum or 0.7071 max
If R = 1, then P = (0.7071 × V)2 / 1 or (0.7071 × I)2 × 1
Therefore, P = 0.5V or 0.5I
Bandwidth and Half-Power Points
So what happens is, at this cut-off frequency, the power that is finally supplied to the load gets kind of “halved” meaning it is now just 50% of what it was before, right?
Because of this when we check the frequency response curve then we can say that the bandwidth (BW) of this curve is basically the range of frequencies that lie between these two points where the power becomes half—also known as the half-power points.
Decibel Gain and Its Calculation
Now when we dealing with voltage gain then we go with 20log10(Av), and if it is current gain then we use 20log10(Ai). But when it comes to power gain, then we do not use 20, instead we take 10log10(Ap).
Now do not start thinking that just because we use 20 for voltage and current, it means 20 is simply double of 10—no, that is not how it works!
The thing is, decibel (dB) is all about power ratios, not some direct power level measurement. Also one more thing—gain in dB can go both ways, meaning it can be positive or negative.
If it is positive then that means there is an actual gain (amplification) but if it is negative then it is doing the opposite, meaning it is cutting down or attenuating the signal.
Voltage, Current, and Power Gain Comparison (Decibel Gain Equivalents)
Alright, now we can put all this voltage, current and power gain stuff together in the following table to make it clearer.
| dB Gain | Voltage or Current Gain 20log10(A) | Power Gain 10log10(A) |
| -6 | 0.5 | 0.25 |
| -3 | 0.7071 or 1/√2 | 0.5 |
| 0 | 1 | 1 |
| 3 | 1.414 or √2 | 2 |
| 6 | 2 | 4 |
| 10 | 3.2 | 10 |
| 20 | 10 | 100 |
| 30 | 32 | 1,000 |
| 40 | 100 | 10,000 |
| 60 | 1,000 | 1,000,000 |
The open-loop voltage gains (AVO) of operational amplifiers may climb to more than 1,000,000 or 100dB.
Solving a Decibels Problem #1
So let us say we have some electronic system and when we put in a 10mV signal, this system gives out a 30mV output voltage. Now we need to figure out how much this gain is in decibels (dB). So how do we calculate the dB value of this system’s output voltage? Let us find out below.
Av dB = 20 log10(Av)
Av dB = 20 log10(Vout / Vin) = 20 log10(30mV / 10mV) = 20 log10(3)
Therefore, Av dB = 9.54 dB
Solving a Decibels Problem #2
Now take another case. We have an audio amplifier and when the signal frequency is 1kHz, it is pumping out 10W of power. But then, when the signal frequency changes to 10kHz, then output power drops down to just 1W. So the question is, how much has the power changed in dB? Let us calculate that below.
Ap dB = 10 log10(Ap)
Ap dB = 10 log10(Pout / Pin) = 10 log10(0.5W / 8W) = 10 log10(0.0625)
Therefore, Ap dB = -12.04 dB
Conclusions
So in this tutorial we have checked and understood how an electronic circuit decides the particular range of frequencies it can work with.
This working range is what we call its frequency response. When we talk about the frequency response of a circuit or device then we simply mean how it behaves when we feed signals of different frequencies into it.
It tells us how much of the signal is allowed to pass through and how the gain (which means how much the circuit amplifies or allows the signal) changes when the frequency keeps increasing or decreasing.
Now to properly see and study this frequency response, then we use Bode plots. These are special kinds of graphs that give us a clear picture of how a circuit reacts to different frequencies. Bode plots help designers solve circuit-related problems.
Usually in these plots, then we get two different graphs—one shows the gain magnitude and the other shows the phase shift of the circuit. The horizontal axis (X-axis) always has a logarithmic frequency scale, meaning the frequency values are spaced in a way that covers a large range more conveniently.
Then we come to something called bandwidth. This is just the full range of frequencies that the circuit actually responds to and operates within.
The bandwidth is marked between two specific points—these are called the upper cut-off frequency and the lower cut-off frequency.
These points are also sometimes called corner frequencies. At these points, the power output of the circuit drops to half of its peak value. In technical terms, this means that the gain decreases by 3dB or to about 0.7071 times the maximum gain value.
Now different circuits behave differently in terms of frequency response. Most amplifiers and filters are designed in such a way that they have a flat frequency response.
This means that within their bandwidth (which is also called the passband), they let all signals pass through at nearly the same level without much variation. The gain remains steady over a large range of frequencies.
But then, there are resonant circuits which work differently. These are circuits that allow only a specific range of frequencies to pass through while blocking others.
These circuits are made using resistors (R), inductors (L) and capacitors (C), and the way they behave depends on how their reactance (which means their resistance to AC signals) changes with frequency.
When you check their frequency response on a graph then you will often see a sharp peak at the resonance point. The sharpness of this peak depends on something called the Q-factor (Quality Factor).
If the Q-factor is high then the bandwidth becomes narrow, meaning the circuit will allow only a very small range of frequencies to pass through. If the Q-factor is low then the bandwidth is broader, so more frequencies are allowed in.
References:
Frequency Response of Amplifiers
Frequency Response of a Common-Emitter BJT Amplifier
Leave a Reply